Today's Wall Street Journal carries an article stating that President Biden is expected to call for reducing U.S. greenhouse gas emissions (GHGs) by 50% as of 2030 from a 2005 baseline. It was accompanied by a chart labeled "2018 CO2 Emissions" which shows the U.S. as contributing 15.3% of global GHGs while China accounted for 29.7%.
I suspect most Americans would overestimate our current contribution to GHG emissions and would be unfamiliar with the long-term trend. The WSJ article notes, US emissions are already 21% lower than the 2005 baseline. In 2000, the U.S. accounted for 24.2% of emissions while China was 12.9%.
But what are we talking about when we talk about emissions? That's a subject most journalists and politicians don't understand.
What Counts?
There are three different ways to count what we refer to as Greenhouse Gas Emissions.
The first is CO2 emissions from fuel combustion, which is what the Journal chart portrays. But this does not capture the full picture because, despite the widespread impression, CO2 emissions from fuel combustion are not equivalent to GHG emissions.
There is a second category of greenhouse gases unconnected (with one exception) to fossil fuel consumption and CO2. These substances contribute to warming because of their chemical and physical properties. These are:
Methane: largest sources production and transmission of fossil fuels (32%) and livestock (28%). Rice cultivation on flooded rice fields is another major source of methane.
Nitrous oxide (N2O): largest source is agriculture - manure and use of nitrogen fertilizers.
Hydrofluorocarbons (HFCs): used in refrigeration, air conditionings, building insulation, fire extinguishing systems. In the 1990s and early 2000s many companies switched to using HFCs in order to cease using CFCs which were discovered to damage atmospheric ozone.
Perfluorochemicals (PFCs): compounds that repel both oil and water and used in many industrial and consumer products.
Sulfur Hexafluoride (SF6): used as electrical insulator and arc suppressant. Essential to maintenance of electrical grids. No known substitutes.
Although all of these substances are emitted in far less volume than CO2, scientists have calculated that the Global Warming Potential (GWP) for each is substantially higher than for equivalent amounts of CO2.
Methane is estimated to have a GWP 21X higher than CO2. For N2O it is 310X higher, for HFCs 150-5,000 times higher, PFCs 6,000-9,000X, and for SF6 23,900X. As you can see, even a small release of SF6 is significant.
We will refer to these as GWP substances going forward.
In the final category are CO2 emissions related to land-use, including deforestation, which is a significant factor in countries like Brazil and India.
A full GHG accounting would require counting all three categories. It's important, because if proponents of action want to determine whether any proposed action might be effective you need to accurate count what you are trying to track. Anytime you read an article on GHG emission by country try to figure out what they are actually counting.
How Are We Counting?
At the most basic level, CO2 emissions from fossil fuel combustion, are subject to the least variation. However, there are several different government agencies that are doing the accounting and there is some variation based upon methodology and how they account for uncertainties.
For instance, the chart in the Journal article is sourced to the International Energy Agency (IEA), a source I've also relied on in the past. In the text it also states that U.S. emissions for 2020 are expected to be 21% lower than the 2005 baseline, but no source for the assertion is identified.
Another source I've used in the past is the Netherlands Environmental Assessment Agency which has been doing annual reports on CO2 and GHG emissions globally for the past twenty years. If you look at the report issued by NEA in 2020 with emissions estimates as of 2019, you'll find different numbers than those of the IEA. For instance, 2018 fossil fuel related emissions in the U.S. are 4.92 gigatons according to the IEA and 5.24 in the NEA report. The discrepancy is even bigger for China, which IEA reports as 9.6 gigatons and NEA as 11.2. Even within the definition of fossil fuel combustion the agencies differ as to what is included.
Once you start including GWP substance related emissions like methane, HFCs and SF6 things get even more difficult. Inherently these estimates are more difficult to derive and, particularly in the case of China, may be subject to manipulation. The NEA uses error bars to report its combined CO2 and these emissions and its bar for China are much larger than for the U.S. and EU.
The scope of all of the GWP substances is enormous when combined, increasing the importance of knowing what is being measured. According to the IEA, CO2 fossil fuel combustion emissions in 2018 were 32 gigatons but according to the NEA, 2018 emissions, including GWP substances were 52 gigatons!
The NEA figures for CO2 from fossil fuel combustion show from 2005 to
2019 an increase of 85% in China and decreases in the U.S. and EU of,
respectively, 14% and 22%. For CO2 + the GWP substances, the NEA shows
China with an increase of 70%, a decrease of 7% in the U.S. and 19% in
the EU. As you can see, none of these match the 21% decrease cited in
the Journal article.
And if you try to do a comprehensive global assessment including all land use variants the process will be subject to even more uncertainty.
The NEA Report
Since I have access to the most recent NEA report and not the IEA report, I'll summarize its findings. The NEA uses both fossil fuel emissions and those from substances with GWP.
In recent years, the U.S., EU and Japan have consistently shown decreases while China, India and the Russian Federation have increased. While China emissions are increasing slower in the 2011-19 period than they did in 2000-10, the opposite is true for India.
As of 2019 China was 28% of global GHG emissions while the U.S. was 13%. Whether it is the IEA or NEA, the specific numbers are different but the conclusions are the same. In 2000 the U.S. had double the emissions of China while today it is reversed.
Here is the long term trend as shown in a NEA graphic:

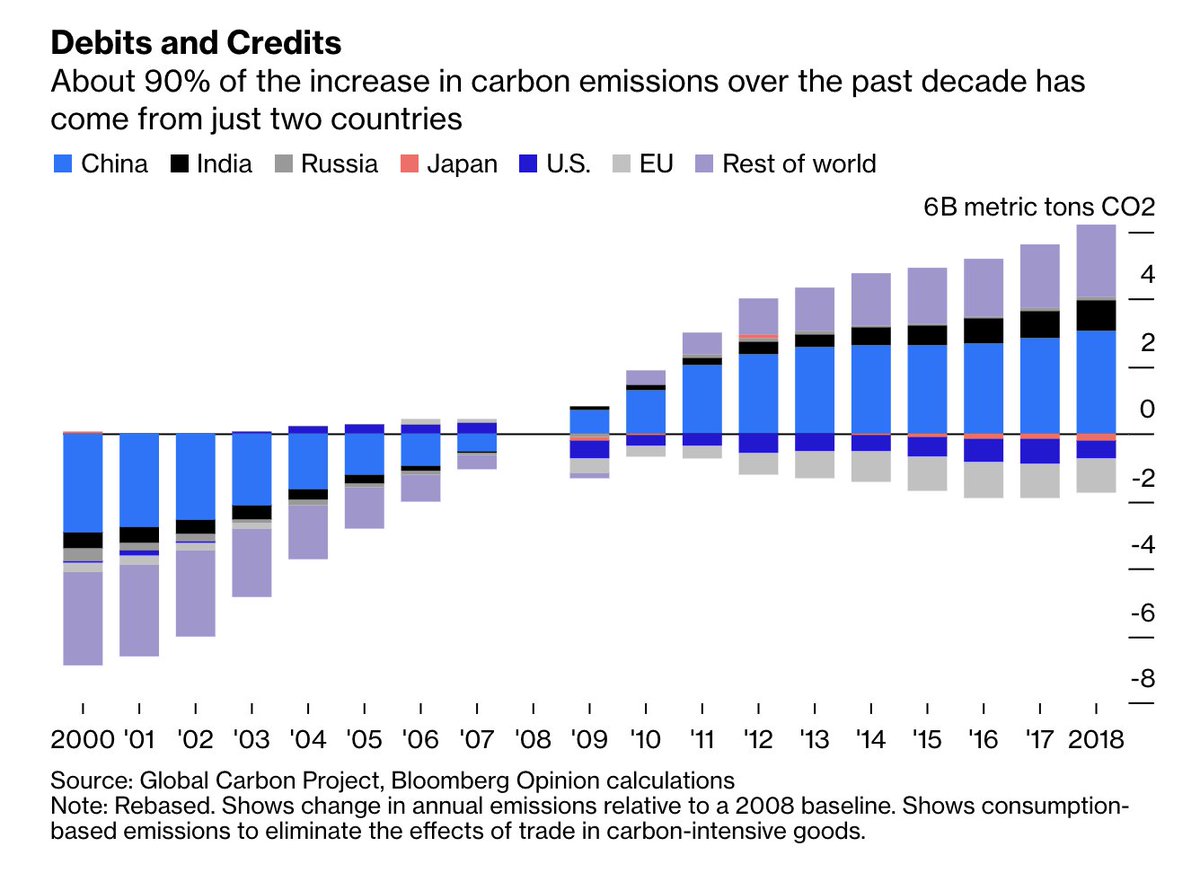
The reductions proposed by the Biden Administration are about 1.8 gigatons by 2030, which is equivalent to what China and India added from 2013 to 2019. Under the Paris Accords neither country has agreed to emissions reductions during the next decade. The U.S. goal, if achieved would reduce current global emissions by 3.5% but emissions globally would not be reduced.
A related topic that often comes up when GHG emissions reductions are discussed are historical emissions, usually in the context that although China's current emissions are 2X the U.S., cumulative historical American emissions are much higher. This was a good talking point in 2005 but things have changed since then. I looked at the NEA data from 1990 to 2019 and then at the IEA which has data back to 1970. Assuming the 2020 data is about the same as 2019, over the half century since 1970, China and U.S. emissions are about equal.
China has stated that it will begin reducing its emissions in 2030. If current trends continue for the next decade and if the U.S. takes no further reduction actions, by 2030 China and U.S. emissions will be about equal over the period 1945-2030 (actually China emissions will be slightly higher). Should the U.S. undertake significant reductions the two countries will have had similar cumulative emissions over the past century.
No comments:
Post a Comment